Tuesday, December 29, 2020

LXI - Rigol DSA815 Spectrum Analyzer - remote control

 Following on the series for "GPIB" control of instruments, this post is about LXI control, in particular the Rigol DSA815-TG spectrum analyzer. It is more Linux oriented but commands can be ported to other systems.
Did this out of need since I could not find a single explanatory source of information for all the commands listed besides the programing guide and as all programing guides, they never have a simple; "how to to this"
Most of the command are using the "lxi" tool v1.21. You can use also the gui version "lxi-gui"

LXI is nothing more than LAN extensions for instrumentation control. Same end result as GPIB or Serial port control, that is, you have a system that controls and queries the instrument, only the medium is different on this case, it uses a more modern approach, the Ethernet/LAN.

Recently acquired a Rigol DSA815-TG 1.5Ghz spectrum analyzer and although at the moment I only use computer control for taking some screenshots would be interesting to know how to take more advantage of instrument remote control.

First thing you will need is connect your instrument via the LAN port to your local network, in my case I just connect it back to back to my laptop. Then you will need to set the IP via instrument panel, in my case I used a static IP in the same range as the Ethernet port of the laptop.

Laptop was configured with IP 192.168.1.65 / netmask 255.255.255.0 (/24 for the hard core one)

In case you don't know your instrument IP, case configured by DHCP for example, you can use the "lxi" tool discover command to "automatically" discover the instruments available on you local are network.

==
# lxi discover
Searching for LXI devices - please wait...
 
Broadcasting on interface lo
Broadcasting on interface enp9s0
  Found "Rigol Technologies,DSA815,DSA8A22XXXXXX,00.01.19.00.02" on address 192.168.1.81
Broadcasting on interface wlp12s0
 
Found 1 device
==

If you are more inclined to review some additional protocol specifications,you can find it here.
A simple wireshark capture allows to have an idea of the inner workings of the discovery process.


At this stage you can query the instrument with the classic "*IDN?" command:
 

==
#  lxi scpi --address 192.168.1.81 "*IDN?"
A: Rigol Technologies,DSA815,DSA8A22XXXXXX,00.01.19.00.02
==
Note: I replaced part of the instrument identifier string with X's.


You can also use a normal "telnet" to port 5555 and make de same query:
==
# telnet 192.168.1.81 5555
Trying 192.168.1.81...
Connected to 192.168.1.81.
Escape character is '^]'.
*IDN?
Rigol Technologies,DSA815,DSA8A22XXXXX,00.01.19.00.02
==

Now let's take some data from the instrument, a screenshot for a start, using the lxi tool screenshot option:

==
 # lxi screenshot --address 192.168.1.81 trace.bmp
==

Result is is "trace.bmp file saved on the current working directory:


The screenshot will literary take a screenshot of what's visible on the screen be it a trace or a configuration screen.

Even more complicated screenshot for the command line die hard's:
==
# echo ":PRIV:SNAP? BMP" | nc -w 5 192.168.1.81 5555 | dd bs=1 skip=11 of=screen.bmp
==

Continuing with some other commands...

Display brightness query:

==
# lxi scpi --address 192.168.1.81 "DISP:BRIG?"
==
Note: answer with be a numeric value of the the setting, in my case is "1"

If you need to change to "2" the screen brightness:
==
# lxi scpi --address 192.168.1.81 "DISPlay:BRIGhtness 2"
==


Turning the tracking generator/TG on:

==
# lxi scpi --address 192.168.1.81 "OUTP:STATE 1"
==

Querying the tracking generator/TG status:
==
# lxi scpi --address 192.168.1.81 "OUTP:STATE?"
==
Output will be 1 or 0 if ON or OFF.


Setting and querying the start frequency:

==
# lxi scpi --address 192.168.1.81 "FREQ:START 124Mhz"
==
Query:
==
# lxi scpi --address 192.168.1.81 "FREQ:START?"
==
Note: it will answer the previous set frequency: "124000000"

For stop frequency should be "FREQuency:STOP", bellow for a 450Mhz stop frequency
==
# lxi scpi --address 192.168.1.81 "FREQ:STOP 450Mhz"
==
The result will be like this on the spectrum analyzer:


 Now we need to take/download traces: this for me is the most interesting part since we can take the traces and then compute over the results, for instance in SWR (when trial license expires ) or 3db bandwidth for example.


Download data of trace 1
==
# lxi scpi --address 192.168.1.81 ":TRACe:DATA? TRACe1"
==
Output, (shortened version) will be similar to this:
#9000009014 -2.017071e+01, -5.862679e+01, -6.025334e+01, -6.129734e+01, -6.015621e+01, -6.299181e+01, -5.941000e+01, -6.174416e+01, -5.768233e+01, -6.222626e+01, -6.008302e+01, -6.109689e+01, -6.196978e+01, -6.302518e+01, -6.228621e+01, -6.230527e+01, -6.312371e+01, -6.304392e+01, -6.187805e+01, -6.133699e+01, -6.096120e+01, -5.720531e+01, -5.873640e+01, -6.165216e+01, -5.796873e+01, -5.905419e+01, -5.763849e+01, -6.094759e+01, -6.073965e+01,..

You can "pipe" the command to file this way:
==
# lxi scpi --address 192.168.1.81 ":TRACe:DATA? TRACe1" > trace1.csv
==
Open "trace1.csv" on a spreadsheet software and plot a graph:


To download trace 3 for example:
==
# lxi scpi --address 192.168.1.81 ":TRACe:DATA? TRACe3"
==
If nothing is set for that trace the output will look like this:
#9000009014 -4.000000e+02, -4.000000e+02, -4.000000e+02, -4.000000e+02, -4.000000e+02, -4.000000e+02, -4.000000e+02, -4.000000e+02, -4.000000e+02, -4.000000e+02, -4.000000e+02, -4.000000e+02, -4.000000e+02,...(continues)


As last command on this series, let's query the instrument language:
==
 # lxi scpi --address 192.168.1.81 "SYST:LANG?"
==
Output is on my case: "ENGl"

==========

- In the future will try to add more commands in this document and write some scripts for automation, maybe even a GUI program. 

- If you copy past the command in this post, don't forget to set your instrument IP instead of the one I used (192.168.1.81)

- Rigol DSA800 programing guide can be downloaded at: https://www.batronix.com/files/Rigol/Spektrum-Analysatoren/DSA800/DSA800_ProgrammingGuide_EN.pdf

Hope this helps someone,

Have a nice day!


Saturday, December 26, 2020

VHF Low Pass filter for DRA818V module

 It is best to use the DRA818V VHF voice transceiver module with a low pass filter.

Since I'm building a VHF/UHF transceiver using the 818V and 818U modules, the VHF low pass filter was missing from the build.


This design was based from the one here and only some small values changes made , I placed adjustable cap's on the center elements (the 56pF), so used 10-60pF trimmer cap and used 32pF on the ends (10+22pF parallel). 

Schematic:


 After build did some measurement on the spectrum analyzer:

Final iteration of the trimmers:


 Attenuation at 200Mhz:


Filter shape from 100 to 300Mhz without normalization:


...now I need to finish the remaining of the transceiver..


Have a great day!


Sunday, October 25, 2020

Wavetek 3001 signal generator repair - II

 Following the first repair of the Wavetek 3001, I knew that there was another issue with the 400Hz modulation oscillator, it was doing some "FM" oscillations so in practice I could only use the 1Khz tone.


Troubleshooting and comparing with the 1Khz oscillator, it was visible the waveform at C6/CR2 junction oscillating/FM'ing a little. Interesting enough by probing with the scope at the drain of Q2 it disappeared. I tried first to swap C6 to no effect, then swapped CR2 and it stopped but trying with the diode in and inverted polarization it would continue the same so it was either wrong assembled at the factory or it's for the moment just masking any other situation, probably Q2.
Before the previous testing I replace IC2 with IC1 (for the 1Khz) to no good effect so decided the issues was not the opamp.


I left like that, with the diode replaced (used a 1n4148 for the moment, didn't  even checked the exact spec in the manual)

After demodulation on an envelop detector it's now fine:


..envelope detector circuit and input signal (-25dBm) without the 56 ohm input load resistor connected on the circuit:

..I might start an AM receiver from here...

Since it's a bit of a pain to take and access the modulator/modulation board I opted to solder the diode from the pcb track side and leave it for the moment, also left the original diode in place with one leg open:


Since some times the unleveled light still comes on I suspect further recapping at the internal modules might be needed in the future.

Have a great day!


Sunday, October 18, 2020

Ferranti 5820-99-795-7922 Noise Generator Coupler

 If anyone know the exact specification for this device I appreciate some comments.

Got this from the usual flee bay expecting to have a cheap noise source capable of 10Ghz since they are normally a bit on the expensive side.


Separating the two parts:


This is the power supply side:


And here the noise generator (underneath), a common noise source diagram:


Some similar Ferranti references, so this could be part of the same set:


Im assuming this is a 10 Ghz capable noise generator because of the waveguide and because Ferranti was involved in earlier radar set's at around the 10Ghz range.

End up doing an adapter/transition to SMA using just the noise module part, separating it from the waveguide:


Since I am a bit limited on 10Ghz test equipment the most I could do was connect it to an LNB and checking the level on an DVB-T USB dongle.

Bellow with power on at around 11Ghz (given the LNB offset of 9.750Mhz)

With the generator OFF:

...so I know that there's some noise, anyhow could also be 1.7Ghz noise leaking on the SDR dongle.

I also tested using one LNB as amplifier for the noise (getting the signal before mixing) and then connected the output to the conversion LNB.


The results with the noise generator OFF (on the left) and ON (on the right):


Anyhow since I have no spectrum analyzer capable of 10Ghz, for now I assume it kind of works. I plan to do a filter around 10.3GHz and run noise trough it and then use the LNB and connect to an 1.5Ghz spectrum analyzer (or similar) for better conclusions.

Have a great day!


Sunday, September 20, 2020

DCF 77 Clock controller (hopf - HKW - clock mouse)

 I had a past test on this device but didn't touched it for around two years. Was convinced that it was a software or serial port situation. In the end nothing more than the antenna coil wire broken beneath the enamel (at the coil side) and one other that I had fixed previously at the PCB side. Because I tested continuity from the PCB to the antenna terminals only at that time I didn't realized the second situation until returning to it this last week.

Bellow the device:

And the antenna coil details:

After that sorted it works receiving the DCF 77 transmiter time. It's just a little picky in the direction and placement since I'm currently on the actual range limits. I used "vocap" site for  the actual direction of the signal.

There is a long thread on this device (in German) here. Also has a link for the "RCCD" software if you don't have original DOS software diskette provided with the device, it also runs under "dosemu" in Linux:

A native build for Linux can be found here (thanks to Guntram). I tested under Linux Mint 32 Bit. Bellow the debug output.

In the format HHMMSS and then day of week date year (better visible on the source code).

For 64 Bit Linux Mint you will probably get when running the hopf binary: "No such file or directory" when running "./hopf -d /dev/ttyS0" , you need to install the following lib32 "sudo apt-get install lib32stdc++6"

Inside the box:


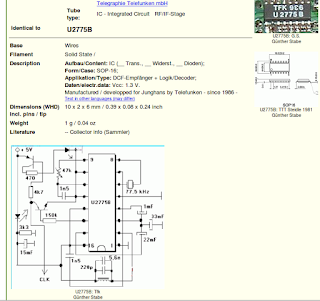
The main chip for the RF reception is marked U2900, I could not find the datasheet for it but did found one that could be similar in terms of connections, as far as I reverse engineering it; the U2775B :


..still not sure if the same or not. 

Anyhow, I'm happy that the device is confirmed working and will go now to the box of the finished stuff without immediate use...!


Have a nice day!


Sunday, August 30, 2020

5LO38I CRT XY Oscilloscope

 Finished today the XY scope based on the 5LO38I CRT tube. It was working for some time but wanted to correct the voltage for the deflection amplifiers and missing a regulator, it was directly connected to the bridge rectifier, now has the required 7805 and 7905 regulators for the positive and negative voltages on this part of the circuit.


It's nothing special, it's based on previous experiments and adding now the deflection circuit. I have no space in the box to add a sweep circuit so it's kept as a generic XY display and not a full oscilloscope.

Because of the lack of shielding on the tube some re trace is seen, also does not help the lack of shielding on the vertical and horizontal amplifier input. As can be seen a bit here:

A bit more visible on the horizontal line.
Also during construction I had to reposition the power transformers because if near the CRT side will influence a lot on the trace quality. You notice that as soon as the power is taken, the dot became much sarper while the power supply caps still hold the charge.

Inside the unit:


The schematic is the one bellow except I added a 7805 and 7905 after the bridge rectifier to make the 5V for the op-amps:


Doing a Christmas tree with an Arduino:

... still had the inverted Y channel at this point.
Bellow the same on the Rigol DS1052E:


 That's it,

Have a nice day!


Sunday, August 23, 2020

GPIB - Rohde & Schwarz URY / URV5 Millivoltmeter

 Having the URY millivoltmeter decided to code a small utility to collect data via GPIB using Linux. As far as I know the URY is functionally the same as the URV5 being the URY a version for a specific marked, this software was tested only on the URY with Linux GPIB and Python.

The meter:


The probe used for testing:


The graphical output along with the launcher icon:


The code for the above software:

===
import Tkinter as tk
import pyvisa
import time
# read power from channel A of the R&S URY millivoltmeter
rm = pyvisa.ResourceManager()
inst = rm.open_resource('GPIB0::12::INSTR')

counter = 0
def counter_label(label):
  def count():
    global counter
    counter += 1
    inst.write("IA,U1,KA0,F3,PA,F3,X1")
    result=inst.read_bytes(21, break_on_termchar='\r\n')
    result=result[9:] # remove the first 9 characters
    label.config(text=str(result)+" dBm")
    label.after(1000, count)
  count()

root = tk.Tk()
root.title("   R&S URY channel A  ")
label = tk.Label(root, fg="light green", bg ="dark green", font = "Helvetica 18 bold italic")
label.pack()
counter_label(label)
button = tk.Button(root, text=' EXIT ', width=35, command=root.destroy)
button.pack()
root.mainloop()
===

A screenshot in case formatting on blogger changes the code:


Made also a utility to get data via command line, could be handy for scripted collection. To get the values from channel B instead of A the code is only different on the instrument query string. The query is also only for dbm output, if you need any other unit or parameters do change the inst.write string.

Code for channel A:

copy/past version bellow:

===
#!/usr/bin/python
# get the power of channel A on R&S URY milivoltmeter

import pyvisa
rm = pyvisa.ResourceManager()

inst = rm.open_resource('GPIB0::12::INSTR')
inst.read_termination = '\n'
inst.write_termination = '\n'
inst.timeout = 5000

try:
  inst.write("IA,U1,KA0,F3,PA,F3,X1")
  exception = 1
  result=inst.read_bytes(20, break_on_termchar='\r\n')
  print(result)
except: exception = 2

if exception == 2:
 print("ERROR")
 exit()

===

Output example:

The query string for channel B:

In case no probe inserted you will get the "URY PB NO PROBE" message

Usage example along with code and diff for channel B:


Hope it helps.

Have a nice day!